Inline GraphViz DOT evaluation for graphs using Emacs, org-mode and org-babel
Contents
With Emacs, org mode and org-babel, it’s possible to evaluate source code samples embedded in your org files and have the output of said evaluation appear inline. This makes for a beautiful literate programming environment. It also enables one to include graphs in one’s documents (org mode, PDF, HTML presentations or blog posts) by using for example GraphViz.
This blog post (obviously authored using Emacs and Org mode) contains short instructions for doing so.
First follow the org-babel documentation and enable source code evaluation for dot by adding the following to your Emacs init.el:
|
|
Then create a new document, and add something like the following dot source code sample to it:
|
|
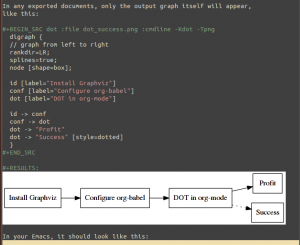
Now press C-c C-c to evaluate this code. Emacs will generate the configured output file dot_success.png and then link to it in an automatically created #+RESULTS section right below it.
You can press C-c C-x C-v to toggle display of inline images to see it directly in Emacs. Alternatively, use M-x org-display-inline-images to switch this on. Whenever you change the DOT source code (press C-c ‘ to edit the dot source code in a separate buffer), just press C-c C-c to re-execute the updated source.
In any exported documents (for examlpe this blog post), only the output graph itself will appear, like this:
Exported as a PDF with C-e l o it looks like this.
In your Emacs, it should look like this:
This approach should work for any of the many languages supported by org-babel. Let me know in the comments what you come up with!


